Quantum ESPRESSO has a package called ev.x that can be used to calculate the bulk modulus of a material. ev.x
basically offers calculation of 4 equation of states, namely: These
equation of states give the equilibrium volume (lattice constant in case
of cubic) as well as the bulk modulus and it’s first derivative.
The procedure is pretty simple. You first need to calculate the
energy of the system at different volumes of unit cell. So you would
basically need to run several SCF calculations at different values of
lattice parameters (thereby different volumes) and note down the
corresponding energies in a text file. For cubic systems
you can have the lattice parameter in the first column and the Energy in
the second column, while for non-cubic systems, you’d note down the
volumes in the first column.
A typical file would look like this:
Let’s say this text file is called: volvsE.txt
Now, we can use this to get the Murnaghan [1] equation of state which is very popular among the scientific community.
Murnaghan EOS is given by:
![\boxed{E(V)=E(V_0)+\frac{B_0V}{B'_0}\left[\frac{\left(V_0/V\right)^{B_0'}}{B'_0-1}+1\right]-\frac{B_0V_0}{B_0'-1} }](https://s0.wp.com/latex.php?latex=%5Cboxed%7BE%28V%29%3DE%28V_0%29%2B%5Cfrac%7BB_0V%7D%7BB%27_0%7D%5Cleft%5B%5Cfrac%7B%5Cleft%28V_0%2FV%5Cright%29%5E%7BB_0%27%7D%7D%7BB%27_0-1%7D%2B1%5Cright%5D-%5Cfrac%7BB_0V_0%7D%7BB_0%27-1%7D++%7D&bg=ffffff&fg=000&s=2 "\boxed{E(V)=E(V_0)+\frac{B_0V}{B'_0}\left[\frac{\left(V_0/V\right)^{B_0'}}{B'_0-1}+1\right]-\frac{B_0V_0}{B_0'-1} }")
Now you just need to run ev.x from the command-line (terminal) and supply inputs to the following prompts:
manas@ubuntu:~$ /home/manas/qe-6.1/bin/ev.x

     Lattice parameter or Volume are in (au, Ang) > Angstrom

     Assuming Angstrom

     Enter type of bravais lattice (fcc, bcc, sc, noncubic) > sc

     Enter type of equation of state :

     1=birch1, 2=birch2, 3=keane, 4=murnaghan > 4

     Input file > volvsE.txt

     Output file > eos
his contains information of the equilibrium volume, bulk modulus and it’s derivative and the minimum energy.
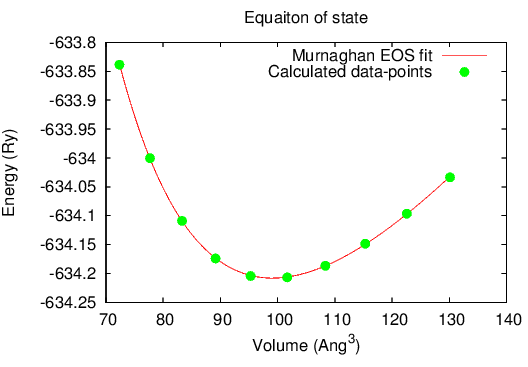
You can use the above generated data to create a neat plot of the
equation of state (as you’d see in many publications), using gnuplot.
The following shell script, plots the calculated data-points from file volvsE.txt
as well as the fitted equation of state curve. [NOTE: This shell script
is for cubic systems only. You’d need to modify the code to implement
it for non-cubic systems]
Create a file called script.sh and add the following code to it:
#!/bin/basha="$1"k="$2"dk="$3"emin="$4"V=$(echo "$a*$a*$a"|bc)echo "set terminal png size 1000,500 set output 'EOSplot.png'set xlabel 'Volume (Ang^3)'set ylabel 'Energy (Ry)'set title 'Equation of state'#set key box linestyle 1f(x)= "$emin"+(x*10**(-30)*"$k"*10**9/"$dk"*(("$V"/x)**"$dk"/("$dk"-1)+1)-"$k"*10**9*"$V"*10**(-30)/("$dk"-1))/(1.6*10**(-19)*13.6)plot f(x) w l title 'Murnaghan EOS fit', 'volvsE.txt' u 1:2 w points pointtype 7 pointsize 2 title 'Calculated data-points'set terminal postscript enhanced color solid 22set output 'EOSplot.eps'set xlabel 'Volume (Ang^3)'set ylabel 'Energy (Ry)'set title 'Equaiton of state'set autoscaleplot f(x) w l title 'Murnaghan EOS fit', 'volvsE.txt' u 1:2 w points pointtype 7 pointsize 2 title 'Calculated data-points'set term x11" >EOSplotScript.p |
Now save the file and open the terminal and run the command:
chmod u+x script.sh
Now simply run the script by providing the four arguments, in the following order: lattice parameter, bulk modulus, derivative of BM, and minimum energy.
Example: ./script.sh 5.5 81 3.9 -588.656
The above command will create a gnuplot script file called: EOSplotScript.p
This can then be run using gnuplot using the following command:
gnuplot ./EOSplotScript.p
When you run this command, it will generate a PNG image as well as an EPS file.
The output looks like this: